Table of Contents
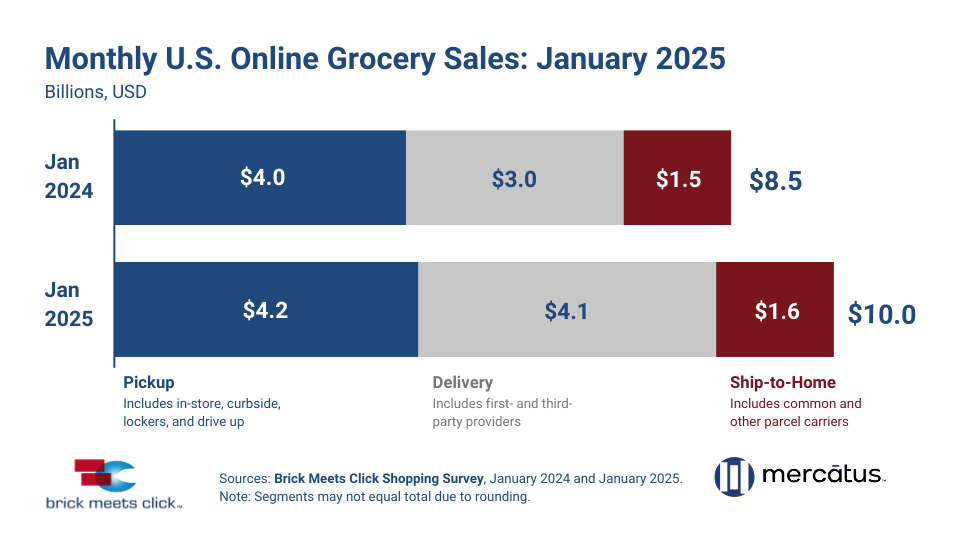
Barrington, Ill. – U.S. online grocery sales started 2025 on a strong note, reaching $10.0 billion in January—a 16.6% year-over-year (YOY) increase, according to the Brick Meets Click Grocery Shopper Survey, sponsored by Mercatus. This marks the sixth consecutive month of sales exceeding $9.5 billion, driven by all three primary fulfillment methods, with delivery leading the charge.
January 2025 vs. January 2024 eGrocery sales comparison
- January 2024: Total sales: $8.5B
- Pickup: $4.0B
- Delivery: $3.0B
- Ship-to-Home: $1.5B
- January 2025: Total sales: $9.6B
- Pickup: $4.2B
- Delivery: $4.1B
- Ship-to-Home: $1.6B
Delivery sales surged by 37% YOY, reaching $4.1 billion. This was fueled by aggressive membership and subscription promotions, especially by Walmart. Increased monthly active users (MAUs), higher order frequency, and slight improvements in average order values (AOVs) contributed to this growth. Delivery’s share of total eGrocery sales rose by 610 basis points (bps) to 41%.
Pickup remained the leading fulfillment method, with a 42% share, though its growth was more modest, at 4% year over year, totaling $4.2 billion. Growth was solely driven by higher AOVs, as MAUs declined and order frequency dropped. Promotional activity favoring Delivery led to a 500-bps decline in Pickup’s market share.
Ship-to-home sales increased 9% yearly to $1.6 billion, supported by more frequent orders despite lower AOVs. Consumers facing in-store obstacles—such as locked-up merchandise to prevent theft—turned to online options. However, its slower growth compared to Delivery led to a 110-bps decline in its market share, now at 16%.
Traditional grocery operators, including Supermarkets and Hard Discounters, face increasing competition from Mass retailers like Walmart. Over the past three years, the Mass channel has consistently served half of all MAUs each January, compared to one-third for Supermarkets and less than 5% for Hard Discounters.
Encouragingly, Grocery’s repeat intent saw a 600-bps YOY increase, closing the gap with Mass retailers. Stronger repeat intent among Pickup users contributed to this trend, even as Mass retailers maintained their lead in Delivery.
While total grocery spending grew just 2.5% yearly, eGrocery sales outpaced it significantly, increasing their share of total grocery sales by 180 bps to over 15%.
The Brick Meets Click/Mercatus Grocery Shopping Survey is an independent research initiative conducted by Brick Meets Click and sponsored by Mercatus. The latest survey, conducted on January 30-31, 2025, surveyed 1,691 adult respondents. Results were adjusted for non-response bias.
For more information about January 2025 results, check out the latest Brick Meets Click eGrocery Dashboard or visit the eGrocery Monthly Sales report page for details on subscribing to the full monthly report.